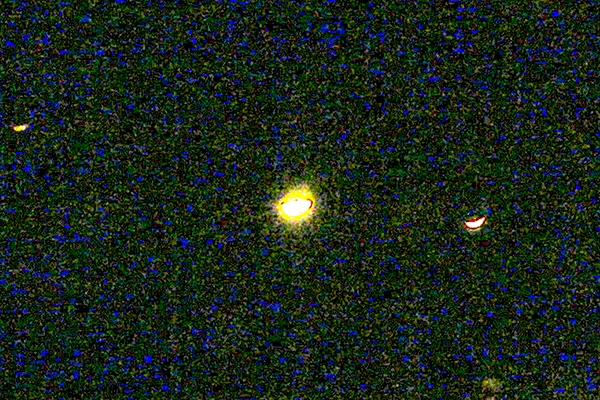
Photograph 1: Camera Sony DSC-R1, sensor detail 3.3 x 2.2 mm²,
sensor detail center offset 1.5 mm horizontal and 3.7 mm vertical,
ISO 400, f = 23 mm, D = f / 8, t = 1/320 s, postprocessed
Version 0.1, Mon, 17 Nov 2014 00:09:20 +0100
not yet finished, see below therefor
When taking a photo or recording a video, it occasionally happens that light sources appear as stars. The prevalent opinion is that the observed spikes have to be seen as results of Fraunhofer diffraction. Fraunhofer diffraction is well studied and an important result of that theory is that, under certain conditions, the optical disturbance observed from an aperture is nothing than the Fourier transform of the appropriate aperture function. On the other hand, the actually observed experimental material prompts questions. So the mentioned camera phenomena show sharp and long spikes without the typical diversity of fringes and color and texture patterns as they normally occur in diffraction figures. One consequence can therefore be to ask whether the Fraunhofer approximations actually apply to the Kirchhoff integral theorem in the present configuration. Another consequence is that there is plenty room for alternative approaches as the reflection one, though the latter approach has serious problems to explain, for example with stray light, the high symmetry properties of the patterns. After rigorously deriving a diffraction theory based on scalar spherical waves and applying that theory to known camera situations, it seems to be possible to validate that diffraction actually yields the experimentally observed material. Nevertheless, the author is still not ready to sweep the reflection approach completely away, whereat an acceptable quantitative ansatz is, at the present time, not available.

Photograph 1: Camera Sony DSC-R1, sensor detail 3.3 x 2.2 mm²,
sensor detail center offset 1.5 mm horizontal and 3.7 mm vertical,
ISO 400, f = 23 mm, D = f / 8,
t = 1/320 s, postprocessed
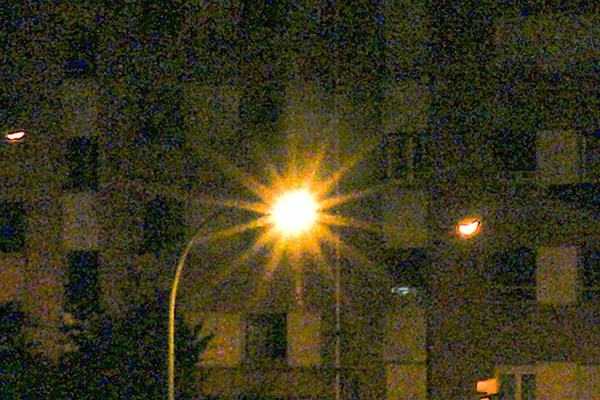
Photograph 2: Camera Sony DSC-R1, sensor detail 3.3 x 2.2 mm²,
sensor detail center offset 1.5 mm horizontal and 3.7 mm vertical,
ISO 400, f = 23 mm, D = f / 8,
t = 1/20 s, postprocessed
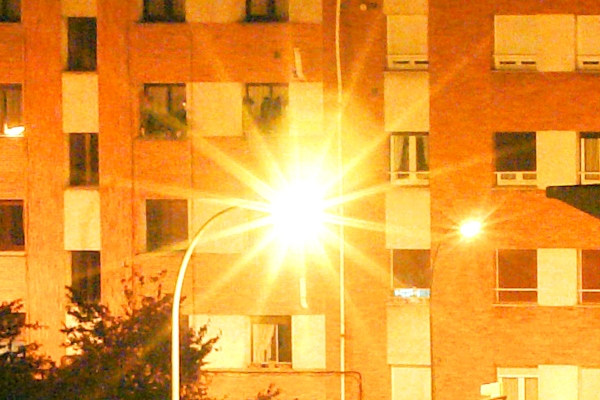
Photograph 3: Camera Sony DSC-R1, sensor detail 3.3 x 2.2 mm²,
sensor detail center offset 1.5 mm horizontal and 3.7 mm vertical,
ISO 400, f = 23 mm, D = f / 8,
t = 1.6 s, postprocessed
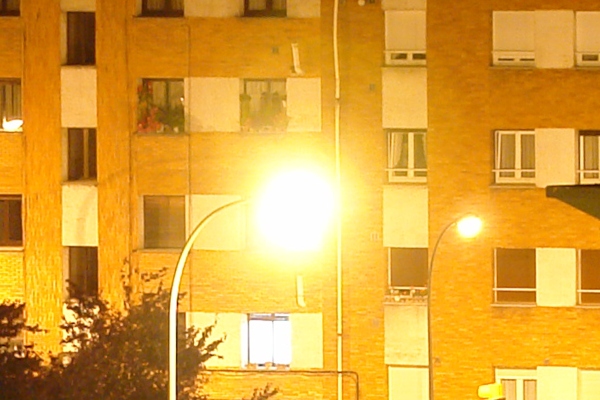
Photograph 4: Camera Sony DSC-R1, sensor detail 3.3 x 2.2 mm²,
sensor detail center offset 1.5 mm horizontal and 3.7 mm vertical,
ISO 400, f = 23 mm, D = f / 3.5,
t = 1.3 s, postprocessed
| (1) | Photographs 1 through 4 above were taken with the same camera and all of them show the same motif, except of course for some window that was closed at any time between taking photograph 3 and photograph 4. |
| (2) | The light sources are high-pressure sodium vapor streetlights. So the light is yellow but not monochromatic. |
| (3) | Exposure data belonging to photograph 1 was chosen in such a manner that the luminous objects appear brightly, near the saturation limit, but the image sensor was, according to the information the camera gave, still not saturated. |
| (4) | Assuming that the image sensor saturation limit would have just reached with photograph 1 exposure data, photograph 2 exposure data would mean a 16-fold image sensor saturation, photograph 3 exposure data a 512-fold saturation, and photograph 4 data a 2173-fold one. |
| (5) | The extension of the color fringes seen in photographs 1 and 2 roughly equals the one of 2 image pixels or 10 μm. That is about 20 times the average wavelength of light. |
| (6) | The color fringe patterns in photographs 1 and 2 correlate with certain high-contrast areas on the streetlight heads. |
| (7) | The color fringe patterns in photographs 1 and 2 are not visibly repeated. |
| (8) | Details of the tilt-and-turn windows seen in photograph 4 allow to guess the resolution of the optical system in all, being of the order of the extension of 1 image pixel or 5 μm. That is about 10 times the average wavelength of light. |
| (9) | The camera has a 7-blade iris diaphragm. The blades are dark with a matte finish. The blades can be seen and can be counted. |
| (10) | Luminous sources in photographs 2 and 3 appear with 14 spikes of high symmetry. |
| (11) | Experiences with spacing templates, these are tools made from steel, show that the mechanical stability of sheet metal significantly falls if the sheet thickness goes essentially under 50 μm. That is about 100 times the average wavelength of light. |
| (12) | The 14 spikes originating in the luminous sources in photographs 2 and 3 do not show color fringes, they appear constantly yellow but with radially decreasing intensity. |
| (13) | The visible length of the 14 spikes originating in the luminous sources in photographs 2 and 3 is about 1000 times the average wavelength of light. |
| (14) | Photograph 4 was taken with the iris diaphragm completely open. |
| (15) | Photograph 4 does not show spikes originating in the luminous sources but it shows large circular halos. |
| (16) | The width of the spikes seems to correlate with the extension of the luminous source while the diameter of the circular halo does not. |
| |1| | (5), (6) and (8) together suggest that the chromatic artifacts cannot be explained by chromatic aberrations of the optics. |
| |2| | (7) and (8) together suggest that the chromatic artifacts should not be explained by diffraction. |
| |3| | (3), (5), (6) and (7) make it probable that the chromatic artifacts seen in photographs 1 and 2 come from interpolation problems at edges with sharp intensity transitions, when transforming image sensor pixel data into image pixel data. Taking the image contents itself into account, it seems that, in HSV representation, Value and Saturation are good whereas Hue is not. In the present case the mentioned interpolation was performed by the camera, not by any external raw-format converter. |
| |4| | (9), (10), (14) and (15) suggest that the spikes originating in the luminous sources come from interactions between the incoming light and the iris diaphragm. |
| |5| | (8), (11), (12) and (13) might us persuade to believe that the spikes originating in the luminous sources should not be explained by diffraction effects. The resolution of the optical device is better than 5 μm, the effect under discussion here is a 1000-wavelength effect, and no part of the optical device has dimensions that come into the order of the wavelength. So some calculation is required. |
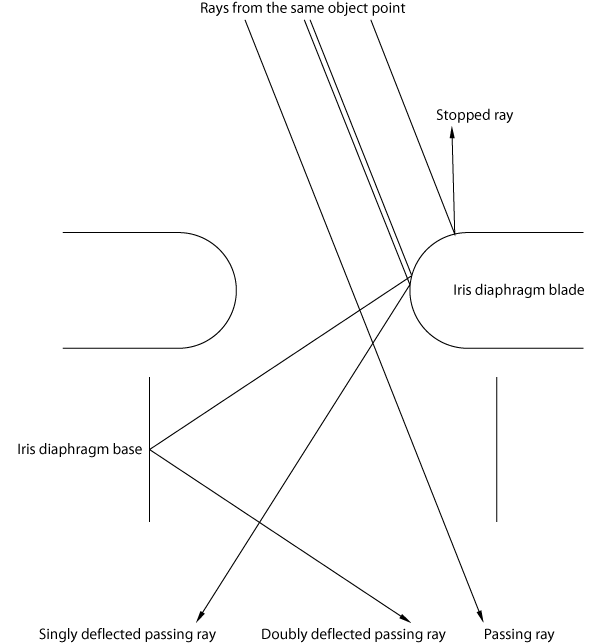
| |6| | In a properly focused and aligned imaging optics, there are two sets of conjugate planes that occur along the optical pathway through the system. In a camera as the Sony DSC-R1, one set consists of the object plane and the sensor plane and is referred to as the field or image-forming conjugate set, while the other set consists of only one member, the aperture stop or iris diaphragm plane, and is referred to as the pupil conjugate set, or as the illumination conjugate set in case of microscopes or electron beam microlithography machines, for example. Each plane within a set is said to be conjugate with the others in that set because the imaging condition between them is pairwise fulfilled. Contrariwise, each plane within a set is said here to be disjoint with the planes in the other set because some anti-imaging condition between them is pairwise fulfilled. The optical train of certain systems exhibits a segment where one finds two disjoint planes beside each other without an optically active device between them. In such a case, the relationship between the ray coordinates in the disjoint planes is quite obvious. Unfortunately, cameras do not belong to those systems. The point with respect to disjoint planes is that the ray coordinates exchange their roles when passing the way from a plane of the pupil conjugate set, the iris diaphragm plane, for example, to a plane of the field conjugate set, the image sensor plane, for example. So, in the iris diaphragm plane, the whole image information the light bundle carries is fairly completely encoded as a ray slope distribution, whereas the intersection points, the points where the rays pass that plane, are, with respect to the image contents, of nearly no importance. Therefore, iris diaphragms as a special implementation of aperture stops are normally mounted in pupil planes to control the image brightness without changing the field of view. If now the ray slope distribution, containing the essential image information, is somehow affected by certain perturbations in a pupil plane, then an image contents modification has to be expected in a subsequent field plane, i.e. in the sensor plane. Such modifications can be seen here in photographs 2, 3 and 4. We have three cases. Firstly, an important part of the rays passes the iris diaphragm without interaction, otherwise, there would not be a nice image on the sensor. Secondly, another important part of the rays is stopped down, either heating up the diaphragm or being reflected back, otherwise, the image on the sensor would probably be too bright. Finally, a small part of the rays hits the edges of the diaphragm, which are always rounded off, recall (11), and which are always somewhat reflecting, like a mirror, like a Lambertian, or like a mixture of both. Since the latter reflections take place in or near a pupil plane, the image on the sensor must suffer a certain modification. Specular reflections, the mirror-type ones, will cause quite sharp image contents changes that will correlate with the diaphragm shape. Diffuse reflections, which obey Lambert's law, will cause halos that will or will not correlate with the diaphragm shape. (3) and (9) might explain why photograph 1 does not show spikes, the percentage of by reflections additionally tilted rays is small. (4) might explain why photographs 2, 3 and 4 do show spikes and/or halos, the percentage of additionally tilted rays is small but the intensity is immense. With (9), we furthermore understand why photographs 2 and 3 show not only spikes but also halos, even matte surfaces can reflect anything, probably more like a Lambertian. (14) and (15) explain that there are no spikes but halos in photograph 4. There should be any circular limitation in or near the diaphragm plane. (10) suggests that there must occur a second reflection a little after the iris diaphragm to come from 7 blades to 14 spikes. We are in agreement with (12), single or double reflections do not change colors here. Summarizing, the spikes could also be explained by specular reflections at the iris diaphragm edges, with the option of other reflections somewhat after. |
The aim of considerations under such a headline is to find out whether it is possible to simulate the discussed spikes by means of a computer program based on a rigorous diffraction theory. It is believed that such a way of doing also gives the opportunity to understand diffraction somewhat better.
It is assumed that every luminous source point, exemplarily located at $\vec{r}_{\mathrm{s}}$, independently and stationary emits radiation of the following form. $$\label{labelsourcesidewavefunction}\varPsi_{\mathrm{s}\bullet}(t,\vec{r}\:\!')=A_{\mathrm{s}\bullet}% \frac{e^{\;\!\displaystyle\imath\;\!(\omega\:\!t-k|\vec{r}\:\!'-\vec{r}_{\mathrm{s}}|)}}{% k|\vec{r}\:\!'-\vec{r}_{\mathrm{s}}|}$$ $\vec{r}\:\!'$ is the point of observation and $A_{\mathrm{s}\bullet}$, $\vec{r}_{\mathrm{s}}$, $\omega$ and $k$ are particular emitter parameters. (\ref{labelsourcesidewavefunction}) describes a scalar spherical wave that is monochromatic and of infinite duration. Such an approach is a rough approximation to the real world in this context because we ignore all effects from polarization and do not consider the wavelet character of natural light. Anyway, (\ref{labelsourcesidewavefunction}) should represent here the wave function belonging to the radiation one source point emits. That wave function is valid in the domain in front of the camera. We are now interested in the appropriate wave function beyond the camera optics, in the domain in front of the sensor where the light has passed the lenses and the diaphragm. To obtain those wave function, there are several ways to do so.
We take spatial derivatives of first and second order. \begin{align}% \label{labelnablasourcesidewavefunction}% \nabla_{\;\!\!\vec{r}\:\!'}\varPsi_{\mathrm{s}\bullet}(t,\vec{r}\:\!')&=(-1)% \frac{\imath\:\!k|\vec{r}\:\!'-\vec{r}_{\mathrm{s}}|+1}{|\vec{r}\:\!'-\vec{r}_{\mathrm{s}}|}% \varPsi_{\mathrm{s}\bullet}(t,\vec{r}\:\!')% \frac{\vec{r}\:\!'-\vec{r}_{\mathrm{s}}}{|\vec{r}\:\!'-\vec{r}_{\mathrm{s}}|}\\ \label{labellaplacesourcesidewavefunction}% \Delta_{\;\!\vec{r}\:\!'}\varPsi_{\mathrm{s}\bullet}(t,\vec{r}\:\!')&=(-1)\;k^2\;% \varPsi_{\mathrm{s}\bullet}(t,\vec{r}\:\!')% \end{align} With respect to some second function, $$\label{labelgreensfunction}G(t,\vec{r}-\vec{r}\:\!')=A_{\mathrm{g}}% \frac{e^{\;\!\displaystyle\imath\:\!(\omega\:\!t-k|\vec{r}-\vec{r}\:\!'|)}}{k|\vec{r}-\vec{r}\:\!'|}\;\;\;,$$ also representing a spherical wave but with its origin at $\vec{r}\:\!'$, it formally happens the same. \begin{align}% \label{labelnablagreensfunction}% \nabla_{\;\!\!\vec{r}\:\!'}{G(t,\vec{r}-\vec{r}\:\!')}&=% \frac{\imath\:\!k|\vec{r}-\vec{r}\:\!'|+1}{|\vec{r}-\vec{r}\:\!'|}% G(t,\vec{r}-\vec{r}\:\!')% \frac{\vec{r}-\vec{r}\:\!'}{|\vec{r}-\vec{r}\:\!'|}\\ \label{labellaplacegreensfunction}% \Delta_{\;\!\vec{r}\:\!'}{G(t,\vec{r}-\vec{r}\:\!')}&=(-1)\;k^2\;% G(t,\vec{r}-\vec{r}\:\!')% \end{align} Recall, $\vec{r}\:\!'$ is exactly that position at which (\ref{labelsourcesidewavefunction}), the spherical wave originated at $\vec{r}_{\mathrm{s}}$, is measured. Now both functions are used to form Green's second identity. $$\label{labelgreenssecondidentity}\int\limits_{V'}\!{\mathrm{d}}^3r'% \left(\varPsi_{\mathrm{s}\bullet}\;\Delta_{\;\!\vec{r}\:\!'}{G}-% G\;\Delta_{\;\!\vec{r}\:\!'}\varPsi_{\mathrm{s}\bullet}\right)=% \oint\limits_{\partial{V'}}{\mathrm{d}}^2r'% \left(\varPsi_{\mathrm{s}\bullet}\;\nabla_{\;\!\!\vec{r}\:\!'}{G}-% G\;\nabla_{\;\!\!\vec{r}\:\!'}\varPsi_{\mathrm{s}\bullet}\right)% \cdot\;\!\vec{n}\:\!'$$ With (\ref{labelsourcesidewavefunction}) through (\ref{labellaplacegreensfunction}) in (\ref{labelgreenssecondidentity}), it immediately follows $$\label{labelgreenssecondidentitywosings}0\;=\frac{A_{\mathrm{s}\bullet}A_{\mathrm{g}}}{k}% e^{\;\!\displaystyle2\imath\;\!\omega\:\!t}% \oint\limits_{\partial{V'}}{\mathrm{d}}^2r'\bigg((\imath+\frac{1}{k|\vec{r}\:\!'-\vec{r}_{\mathrm{s}}|})% \frac{\vec{r}\:\!'-\vec{r}_{\mathrm{s}}}{|\vec{r}\:\!'-\vec{r}_{\mathrm{s}}|}\cdot\vec{n}\:\!'+% (\imath+\frac{1}{k|\vec{r}-\vec{r}\:\!'|})\frac{\vec{r}-\vec{r}\:\!'}{|\vec{r}-\vec{r}\:\!'|}\cdot\vec{n}\:\!'% \bigg)\frac{e^{\;\!\displaystyle-\imath\:\!k(|\vec{r}\:\!'-\vec{r}_{\mathrm{s}}|+|\vec{r}-\vec{r}\:\!'|)}% }{|\vec{r}\:\!'-\vec{r}_{\mathrm{s}}||\vec{r}-\vec{r}\:\!'|}\;\;\;,$$ where it has to be ensured of course that the integration volume is free of singularities. So, the surface surrounding our integration volume will consist of two parts, the one that encloses some part of the emitter-side half space up to the diaphragm plane, and the one that excludes the radiating point itself. The following figure illustrates the actualities.
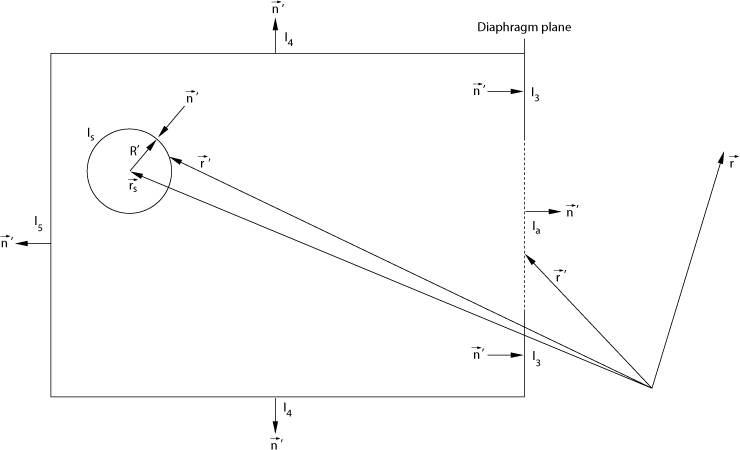
Figure 1: Surfaces surrounding the integration volume
It is seen that (\ref{labelgreenssecondidentitywosings}) can be written as $$0=I_{\mathrm{s}}+I_{\mathrm{a}}+I_{\mathrm{3}}+I_{\mathrm{4}}+I_{\mathrm{5}}\;\;\;,$$ or even as $$\label{labelsurfaceintegrals}% I_{\mathrm{a}}=(-I_{\mathrm{s}})-(I_{\mathrm{3}}+I_{\mathrm{4}}+I_{\mathrm{5}})\;\;\;.$$ $I_{\mathrm{4}}$ might be the integral over a cylinder barrel, $I_{\mathrm{5}}$ might be the one over the appropriate backside cylinder cover, and $I_{\mathrm{3}}$ the one over that part of the frontside cylinder cover in the diaphragm plane that stops the radiation from $\vec{r}_{\mathrm{s}}$. The integrals $I_{\mathrm{3}}$, $I_{\mathrm{4}}$ and $I_{\mathrm{5}}$ need be discussed. So we will firstly not try to obtain their values. We will furthermore not assume that they vanish, and we will also not require that the wave functions vanish at that boundaries. The only that is required here is that the material the stopping boundaries consist of is able to completely absorb any form of arriving energy, meaning that there is no kind of reflection such that (\ref{labelsourcesidewavefunction}) is valid everywhere inside the integration volume and on its borders, with or without actually existing boundaries. Here, if the boundaries are existing, the positions they occupy belong to the integration volume.
The integral over the aperture, $I_{\mathrm{a}}$, is left untouched so far. We write $$\label{labelintegrala}I_{\mathrm{a}}=\frac{A_{\mathrm{s}\bullet}A_{\mathrm{g}}}{k}% e^{\;\!\displaystyle2\imath\;\!\omega\:\!t}% \int\limits_{\mathrm{aperture}}\!\!{\mathrm{d}}^2r'\bigg((\imath+\frac{1}{k|\vec{r}\:\!'-\vec{r}_{\mathrm{s}}|})% \frac{\vec{r}\:\!'-\vec{r}_{\mathrm{s}}}{|\vec{r}\:\!'-\vec{r}_{\mathrm{s}}|}\cdot\vec{n}\:\!'+% (\imath+\frac{1}{k|\vec{r}-\vec{r}\:\!'|})\frac{\vec{r}-\vec{r}\:\!'}{|\vec{r}-\vec{r}\:\!'|}\cdot\vec{n}\:\!'% \bigg)\frac{e^{\;\!\displaystyle-\imath\:\!k(|\vec{r}\:\!'-\vec{r}_{\mathrm{s}}|+|\vec{r}-\vec{r}\:\!'|)}% }{|\vec{r}\:\!'-\vec{r}_{\mathrm{s}}||\vec{r}-\vec{r}\:\!'|}\;\;\;.$$ The integral over the small sphere excluding the radiator, $I_{\mathrm{s}}$, need be evaluated for small values to $R'$. Those who have a good eye will see the result quasi immediately. All the other readers will have to perform a coordinate transformation in accordance with \begin{align}% \label{labelsphericalcoordinatesxd}x'&=x_{\mathrm{s}}+R'\sin\vartheta'\cos\varphi'\\ \label{labelsphericalcoordinatesyd}y'&=y_{\mathrm{s}}\:\!+R'\sin\vartheta'\sin\varphi'\\ \label{labelsphericalcoordinateszd}z'&=z_{\mathrm{s}}\:\!+R'\cos\vartheta'\;\;\;,% \end{align} will have to expand the integrand into a power series with respect to $R'$, and will have to throw away all the terms containing powers ${R'}^i$ with $i\ge1$ to finally obtain $$\label{labelintegrals}(-I_{\mathrm{s}})=4\pi\frac{A_{\mathrm{s}\bullet}A_{\mathrm{g}}}{k}% \frac{e^{\;\!\displaystyle\imath\;\!(2\omega\:\!t-k|\vec{r}-\vec{r}_{\mathrm{s}}|)}}{% k|\vec{r}-\vec{r}_{\mathrm{s}}|}\;\;\;.$$ The reader probably agrees that it is difficult to understand what (\ref{labelintegrals}) really means. Things will become clearer when juxtaposing (\ref{labelintegrals}) and $\varPsi_{\mathrm{s}\bullet}(t,\vec{r}\:\!')$ from (\ref{labelsourcesidewavefunction}) in the following manner. $$\label{labelobscureidentity}% {\left.(-I_{\mathrm{s}})\right|}_{\vec{r}=\vec{r}\:\!'}=\;\!\varPsi_{\mathrm{s}\bullet}(t,\vec{r}\:\!')\;\;\;,$$ or even $$4\pi\frac{A_{\mathrm{s}\bullet}A_{\mathrm{g}}}{k}% \frac{e^{\;\!\displaystyle\imath\;\!(2\omega\:\!t-k|\vec{r}\:\!'-\vec{r}_{\mathrm{s}}|)}}{% k|\vec{r}\:\!'-\vec{r}_{\mathrm{s}}|}=% A_{\mathrm{s}\bullet}% \frac{e^{\;\!\displaystyle\imath\;\!(\omega\:\!t-k|\vec{r}\:\!'-\vec{r}_{\mathrm{s}}|)}}{% k|\vec{r}\:\!'-\vec{r}_{\mathrm{s}}|}$$ lead to $$\label{labelag}A_{\mathrm{g}}=\frac{k}{4\pi}e^{\;\!\displaystyle-\imath\;\!\omega\:\!t}\;\;\;.$$ With (\ref{labelag}), the identities (\ref{labelgreensfunction}), (\ref{labelintegrals}) and (\ref{labelintegrala}) take the form $$\label{labelgreensfunctionfin}G(t,\vec{r}-\vec{r}\:\!')=G(\vec{r}-\vec{r}\:\!')=% \frac{e^{\;\!\displaystyle-\imath\:\!k|\vec{r}-\vec{r}\:\!'|}}{4\pi|\vec{r}-\vec{r}\:\!'|}\;\;\;,$$ $$\label{labelintegralsfin}(-I_{\mathrm{s}})=A_{\mathrm{s}\bullet}% \frac{e^{\;\!\displaystyle\imath\;\!(\omega\:\!t-k|\vec{r}-\vec{r}_{\mathrm{s}}|)}}{% k|\vec{r}-\vec{r}_{\mathrm{s}}|}\;\;\;,$$ and $$\label{labelintegralafin}I_{\mathrm{a}}=\frac{A_{\mathrm{s}\bullet}}{4\pi}% e^{\;\!\displaystyle\imath\;\!\omega\:\!t}% \int\limits_{\mathrm{aperture}}\!\!{\mathrm{d}}^2r'\bigg((\imath+\frac{1}{k|\vec{r}\:\!'-\vec{r}_{\mathrm{s}}|})% \frac{\vec{r}\:\!'-\vec{r}_{\mathrm{s}}}{|\vec{r}\:\!'-\vec{r}_{\mathrm{s}}|}\cdot\vec{n}\:\!'+% (\imath+\frac{1}{k|\vec{r}-\vec{r}\:\!'|})\frac{\vec{r}-\vec{r}\:\!'}{|\vec{r}-\vec{r}\:\!'|}\cdot\vec{n}\:\!'% \bigg)\frac{e^{\;\!\displaystyle-\imath\:\!k(|\vec{r}\:\!'-\vec{r}_{\mathrm{s}}|+|\vec{r}-\vec{r}\:\!'|)}% }{|\vec{r}\:\!'-\vec{r}_{\mathrm{s}}||\vec{r}-\vec{r}\:\!'|}\;\;\;.$$ Now we are able to understand what happened so far. Green's second identity was established taking two solutions to the Helmholtz differential equation. Excluding singularities, the volume integral vanished because the integrand vanished. What remained were obscure surface integrals. Coming back to the present, we discover that requiring (\ref{labelobscureidentity}) yielding (\ref{labelag}) is the point here. $G(\vec{r}-\vec{r}\:\!')$ immediately emerges as Green's function belonging to the operator $\Delta+k^2$. $(-I_{\mathrm{s}})$ represents the wave function in front of our camera, up to the diaphragm plane, whereat it is of no importance whether $\vec{r}$ denotes the observer point coordinates, as in (\ref{labelintegralsfin}), or $\vec{r}\:\!'$, as in (\ref{labelsourcesidewavefunction}). But, if $(-I_{\mathrm{s}})$ represents the wave function in front of our camera, then $I_{\mathrm{a}}$ will be the wave function behind the diaphragm, the function that we are looking for.
$(-I_{\mathrm{s}})$ and $I_{\mathrm{a}}$ need be discussed somewhat more. Both integrals will differ from each other, as seen with (\ref{labelsurfaceintegrals}). Recall, nobody required that $I_{\mathrm{3}}$, $I_{\mathrm{4}}$ or $I_{\mathrm{5}}$ have to vanish. Further, $(-I_{\mathrm{s}})$ and $I_{\mathrm{a}}$ cannot be compared. $(-I_{\mathrm{s}})$ is the wave function before and in the diaphragm plane, $(-I_{\mathrm{s}})$ is invalid behind that plane, and $I_{\mathrm{a}}$ is the wave function after the diaphragm plane, $I_{\mathrm{a}}$ is invalid before that plane and singular in it. So we can only trust. We rename (\ref{labelintegralsfin}) and (\ref{labelintegralafin}) as follows. $$\label{labelsourcesidewavefunctionfin}\varPsi_{\mathrm{s}\bullet}(t,\vec{r})=A_{\mathrm{s}\bullet}% \frac{e^{\;\!\displaystyle\imath\;\!(\omega\:\!t-k|\vec{r}-\vec{r}_{\mathrm{s}}|)}}{% k|\vec{r}-\vec{r}_{\mathrm{s}}|}$$ $$\label{labeltargetsidewavefunctionpre}\varPsi_{\mathrm{t}\bullet}(t,\vec{r})=% \frac{A_{\mathrm{s}\bullet}}{4\pi}e^{\;\!\displaystyle\imath\;\!\omega\:\!t}% \int\limits_{\mathrm{aperture}}\!\!{\mathrm{d}}^2r'\bigg((\imath+\frac{1}{k|\vec{r}\:\!'-\vec{r}_{\mathrm{s}}|})% \frac{\vec{r}\:\!'-\vec{r}_{\mathrm{s}}}{|\vec{r}\:\!'-\vec{r}_{\mathrm{s}}|}\cdot\vec{n}\:\!'+% (\imath+\frac{1}{k|\vec{r}-\vec{r}\:\!'|})\frac{\vec{r}-\vec{r}\:\!'}{|\vec{r}-\vec{r}\:\!'|}\cdot\vec{n}\:\!'% \bigg)\frac{e^{\;\!\displaystyle-\imath\:\!k(|\vec{r}\:\!'-\vec{r}_{\mathrm{s}}|+|\vec{r}-\vec{r}\:\!'|)}% }{|\vec{r}\:\!'-\vec{r}_{\mathrm{s}}||\vec{r}-\vec{r}\:\!'|}$$ With (\ref{labelsourcesidewavefunctionfin}) and (\ref{labeltargetsidewavefunctionpre}), the way of speaking is the following one. If (\ref{labelsourcesidewavefunctionfin}) is the wave function before and in the diaphragm, then (\ref{labeltargetsidewavefunctionpre}) is the one after the diaphragm, no more, no less.
Before we now begin to construct a camera, we should agree upon some abbreviations to simplify in writing. \begin{align}% \label{labelcosinusthetas}\cos\varTheta_{\mathrm{s}}&=% \frac{\vec{r}\:\!'-\vec{r}_{\mathrm{s}}}{|\vec{r}\:\!'-\vec{r}_{\mathrm{s}}|}\cdot\vec{n}\:\!'\\ \label{labelcosinusthetat}\cos\varTheta_{\mathrm{t}}&=% \frac{\vec{r}\;-\vec{r}\:\!'\:\!}{|\vec{r}\;-\vec{r}\:\!'\:\!|}\cdot\vec{n}\:\!'\\ \label{labelss}s_{\mathrm{s}}&=\;\!|\vec{r}\:\!'-\vec{r}_{\mathrm{s}}|\\ \label{labelst}s_{\mathrm{t}}&=\;\!|\vec{r}\;-\vec{r}\:\!'\:\!|% \end{align} With (\ref{labelcosinusthetas}) through (\ref{labelst}), (\ref{labeltargetsidewavefunctionpre}) finally appears as $$\label{labeltargetsidewavefunctionfin}\varPsi_{\mathrm{t}\bullet}(t,\vec{r})=\frac{\,A_{\mathrm{s}\bullet}}{4\pi}% e^{\;\!\displaystyle\imath\;\!\omega\:\!t}\int\limits_{\mathrm{aperture}}\!\!{\mathrm{d}}^2r'% \left((\imath+\frac{1}{\;\!k\:\!s_{\mathrm{s}}})\cos\varTheta_{\mathrm{s}}% +(\imath+\frac{1}{\;\!k\:\!s_{\mathrm{t}}})\cos\varTheta_{\mathrm{t}}\right)% \frac{e^{\;\!\displaystyle-\imath\:\!k(s_{\mathrm{s}}+s_{\mathrm{t}})}}{s_{\mathrm{s}}s_{\mathrm{t}}}\;\;\;.$$ (\ref{labeltargetsidewavefunctionfin}) represents the Fresnel-Kirchhoff integral theorem without the so-called wave zone approximation.
Next is to design a camera with two thin lenses incorporated. The lenses are assumed to be free of aberrations.
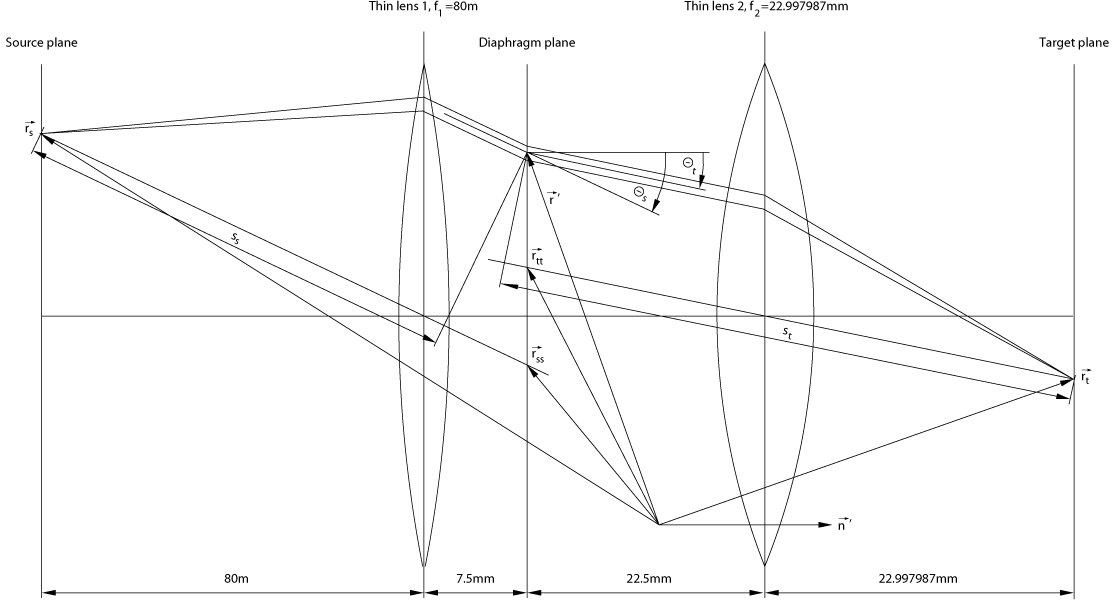
Figure 2: Simplified camera optics, 80 m source distance, 23 mm focal length
Figure 2 shows a properly focused and aligned imaging optics. The source and target planes are conjugate planes. All planes between the lenses belong to the other set of planes that are disjoint with source and target. So the iris diaphragm could be mounted everywhere between the lenses. Most dimensions have arbitrarily been chosen such that the resulting device resembles the above camera at its operating point while taking photographs 1 through 3. As discussed, a spherical wave is emitted at $\vec{r}_{\mathrm{s}}$ and is converted into a plane wave by lens 1. It is assumed that lens 1 is large enough to handle the whole half space without truncation. That plane wave is then stopped down by the iris diaphragm in the aperture plane. If there were no diaphragm mounted, then that plane wave would be converted into spherical wave again by lens 2. But the plane wave is stopped down and so the above theory comes into play. We see the differences between geometrical optics and wave optics. In geometrical optics, with $\vec{r}_{\mathrm{s}}$ and $\vec{r}\:\!'$, $\vec{r}_{\mathrm{t}}$ is determined. In wave optics, all the three can freely be chosen, and what comes from $\vec{r}_{\mathrm{s}}$, passes $\vec{r}\:\!'$, and arrives at $\vec{r}_{\mathrm{t}}$ is described by a complicated expression as (\ref{labeltargetsidewavefunctionfin}). Some similarities with quantum-mechanical considerations cannot be overlooked.
Next is to define auxiliary vectors. \begin{align}% \label{labelrsss}\vec{r}_{\mathrm{sss}}&=\vec{r}_{\mathrm{ss}}-\;\!\vec{r}_{\mathrm{s}}\\ \label{labelrttt}\vec{r}_{\mathrm{ttt}}&=\vec{r}_{\mathrm{t}}-\;\!\vec{r}_{\mathrm{tt}}% \end{align} $\vec{r}_{\mathrm{sss}}$ and $\vec{r}_{\mathrm{ttt}}$ represent the principal rays of the beams, in the ray optics terminology, where both the points $\vec{r}_{\mathrm{ss}}$ and $\vec{r}_{\mathrm{tt}}$ lie in the diaphragm plane and their coordinates can easily be determined. Due to our choice with respect to the refractive lens powers, both source and target are located in the focal planes of their respective lenses. Hence, the cosines appear as follows. \begin{align}% \label{labelcosthetas}\cos\varTheta_{\mathrm{s}}&=% \frac{\vec{r}_{\mathrm{sss}}}{|\vec{r}_{\mathrm{sss}}|}\cdot\;\!\vec{n}\:\!'\\ \label{labelcosthetat}\cos\varTheta_{\mathrm{t}}&=% \frac{\vec{r}_{\mathrm{ttt}}}{|\vec{r}_{\mathrm{ttt}}|}\cdot\;\!\vec{n}\:\!'% \end{align} With further auxiliary vectors, \begin{align}% \label{labelrssd}\vec{r}_{\mathrm{ssd}}&=\vec{r}_{\mathrm{ss}}-\;\!\vec{r}\:\!'\;\;\;,\\ \label{labelrttd}\vec{r}_{\mathrm{ttd}}&=\vec{r}_{\mathrm{tt}}-\;\!\vec{r}\:\!'\;\;\;,% \end{align} the path lengths are finally given by \begin{align}% \label{labelpaths}s_{\mathrm{s}}&=|\vec{r}_{\mathrm{sss}}|-% \frac{\vec{r}_{\mathrm{sss}}}{|\vec{r}_{\mathrm{sss}}|}\cdot\;\!\vec{r}_{\mathrm{ssd}}\;\;\;,\\ \label{labelpatht}s_{\mathrm{t}}&=|\vec{r}_{\mathrm{ttt}}|+% \frac{\vec{r}_{\mathrm{ttt}}}{|\vec{r}_{\mathrm{ttt}}|}\cdot\;\!\vec{r}_{\mathrm{ttd}}\;\;\;.% \end{align} (\ref{labelpaths}) and (\ref{labelpatht}) have been derived through solving a minimum problem, namely, looking for a point at a principal ray such that the distance between that point and $\vec{r}\:\!'$ becomes minimal. Recall, the considerations here have to be done in three dimensions, not only in two ones as figure 2 could mislead to think.
Integrating wave functions is a priori a challenge. The numerical evaluation has been done by means of a computer program in C (click here for download). That program performs the integration over the surface of the aperture in (\ref{labeltargetsidewavefunctionfin}) using cylinder coordinates. For the summation, the mid-ordinate rule is essentially applied except for those surface elements that are excluded or intersected by the diaphragm polygon. The latter surface elements do either not or only partially contribute where the contribution depends on how the intersection turns out. The outer integral goes equidistantly over the radius, and the inner one goes equidistantly over the azimuth. The azimuth step width varies with the radius and fulfills the following conditions. The azimuth step width, $\Delta\varphi$, is determined such that $r\Delta\varphi$ takes the maximum value that is not larger than the radius step width, $\Delta{}r$, and the per definitionem natural number $2\pi/(\Delta\varphi)$ is divisible by twice the iris diaphragm blade number without remainder. Finally, the mentioned computer program can run in parallel over a large number of processing elements using the MPI libraries. The program executes only one collective gathering operation at its end that is high-efficiently implemented by hand only using send/receive primitives. For best performance, 240000 should be divisible by the number of attached processors without remainder.
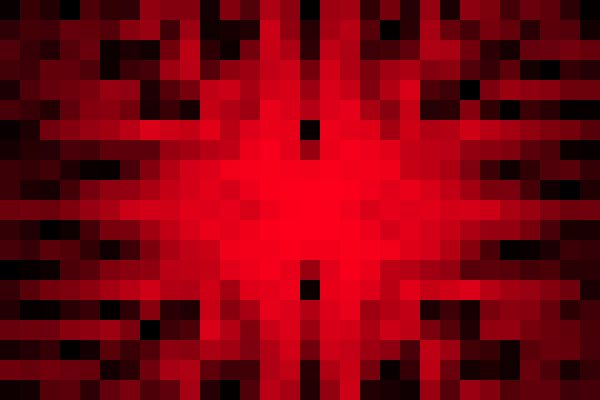
We come to some results. In all the following cases, a regular heptagon has been assumed as aperture. For the first simulations, it has furthermore been assumed that our streetlight consists of just a single point, monochromatically radiating at λ = 643.8 nm (Cd I). (\ref{labeltargetsidewavefunctionfin}) has been evaluated summing up 1.3×10⁹ ordinates per image point. That are 9 samples per wavelength, approximately. Shown is $$\label{labelIntensity}I_\bullet(\vec{r}_{\mathrm{t}})=\left|\;\!% \varPsi_{\mathrm{t}\bullet}(t,\vec{r}_{\mathrm{t}})\:\!\right|^2$$ in the sensor plane at maximum exposure without saturation. With respect to the contrast, the pictures carry straight intensities represented by 8 bit per color channel. The resolution is the one of the Sony DSC-R1 camera.
 |
 |
|
| Picture 1: Spot image simulation, sensor detail 3.3 x 2.2 mm², sensor detail center offset 1.5 mm horizontal and 3.7 mm vertical, f = 23 mm, D = f / 8, λ = 643.8 nm, properly exposed |
Picture 2: Spot image simulation, sensor detail 165 x 110 µm², sensor detail center offset 1.5 mm horizontal and 3.7 mm vertical, f = 23 mm, D = f / 8, λ = 643.8 nm, properly exposed |
Pay attention to the single red point in the center of picture 1. There is not a lot more to say. Either the camera is perfect or the computer program is rotten. To see more we change the wavelength to 20×643.8 nm. For this case, (\ref{labeltargetsidewavefunctionfin}) has been evaluated summing up 3.1×10⁶ ordinates per image point. That are also 9 samples per wavelength.
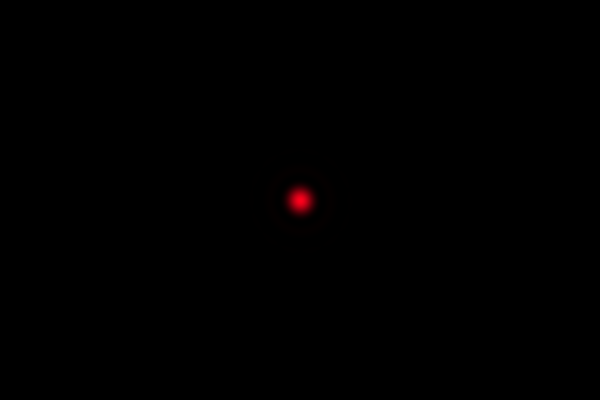 |
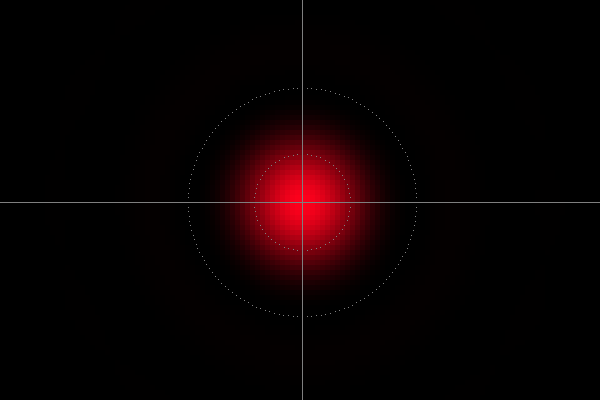 |
|
| Picture 3: Spot image simulation, sensor detail 3.3 x 2.2 mm², sensor detail center offset 1.5 mm horizontal and 3.7 mm vertical, f = 23 mm, D = f / 8, λ = 20×643.8 nm, properly exposed |
Picture 4: Spot image simulation, sensor detail 660 x 440 µm², sensor detail center offset 1.5 mm horizontal and 3.7 mm vertical, f = 23 mm, D = f / 8, λ = 20×643.8 nm, properly exposed |
It seems that the camera actually works perfectly and the computer program does not fail at the first example. With a wavelength of 20×643.8 nm, it appears an Airy-disk-like pattern that is significantly larger than one sensor pixel. Pictures 2 and 4 allow to determine the dimension of that diffraction pattern, the sensor pixels can easily be counted. In addition, picture 4 shows two dotted circles. The inner circle represents the radius where the Airy disk pattern, $$\label{labelairydisk}I(\xi)=I_0{\left(\frac{2J_1(\xi)}{\xi}\right)}^{\!\!2}\;\;\;,$$ exhibits, whether the latter applies to here or not, its half maximum value. $I_0$ is the maximum intensity of that pattern at the center, and $J_1(\xi)$ is the Bessel function of the first kind of order one. $\xi$ is given by $$\label{labelairydiskxi}\xi=\frac{\pi\zeta}{\lambda{}N}$$ where $\zeta$ is the radial distance between a considered image point and the Airy disk center in the sensor plane, $\lambda$ is the wavelength, and $N$ is the f-number of the objective lens, 8 here. The outer dotted circle in picture 4 represents the radius where the Bessel function vanishes the first time. (\ref{labelairydisk}) and (\ref{labelairydiskxi}) follow from the Fraunhofer diffraction theory, i.e. from (\ref{labeltargetsidewavefunctionfin}) with further simplifications that have not been done here.
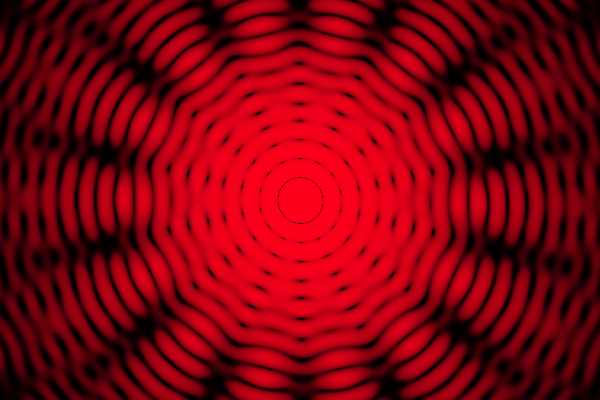
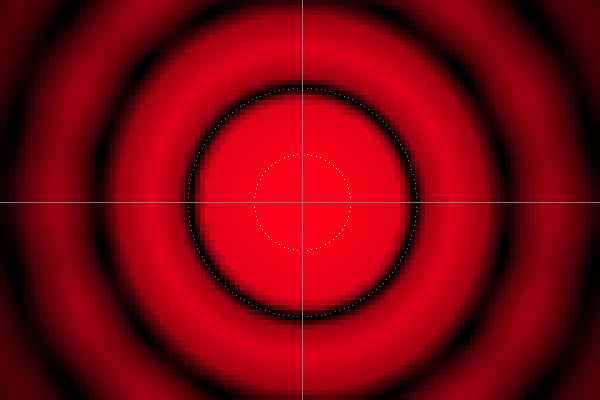
Pictures 3 and 4 show true intensities at maximum exposure without saturation. Same data can also be represented in the following way. We firstly convert from RGB to HSV. HSV Hue and Saturation are left as are, and HSV Value is mapped as follows. Some auxiliary array is created, consecutively containing the Value coordinates of each picture point. That auxiliary array is now sorted by size. As the result the stored entries do not fall from left to right. A new Value is then obtained taking the quotient of the rightmost zero-based array index which points to a stored Value that is not larger than the old Value coordinate in hand, and the rightmost array index. After mapping all the old Values onto new ones, data is converted back from HSV to RGB. Such a way, structures with even extremely high dynamic ranges are getting visible in full. In the following the application of the algorithm described just now is referred to as HSV coordinate Value nonlinearly mapped for contrast adjustment.
 |
 |
|
| Picture 5: Spot image simulation, sensor detail 3.3 x 2.2 mm², sensor detail center offset 1.5 mm horizontal and 3.7 mm vertical, f = 23 mm, D = f / 8, λ = 20×643.8 nm, HSV coordinate Value nonlinearly mapped for contrast adjustment |
Picture 6: Spot image simulation, sensor detail 660 x 440 µm², sensor detail center offset 1.5 mm horizontal and 3.7 mm vertical, f = 23 mm, D = f / 8, λ = 20×643.8 nm, HSV coordinate Value nonlinearly mapped for contrast adjustment |
While picture 3 shows not more than an extended point, picture 5 exhibits a 14-fold symmetry. Picture 6 allows to validate the innermost Bessel function zero belonging to the Airy-disk-like pattern while the foothills are completely lost in picture 4. It is also seen that the outer bright ring in picture 6 starts to get sausage-shaped. So the computer program passed a further test. But beware of believing that the camera will perform such a complex algorithm to represent given data, with or without saturation. What the camera could at most show is seen with pictures 7 and 8.
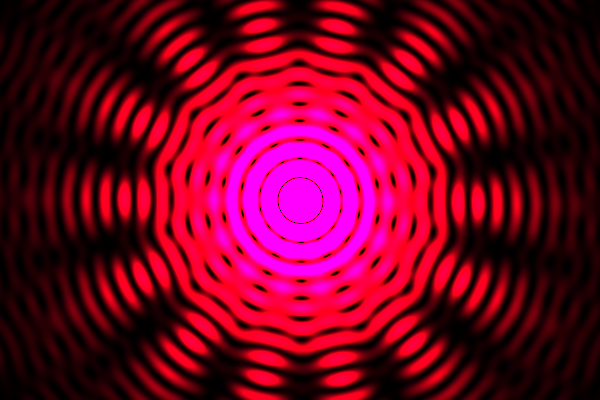 |
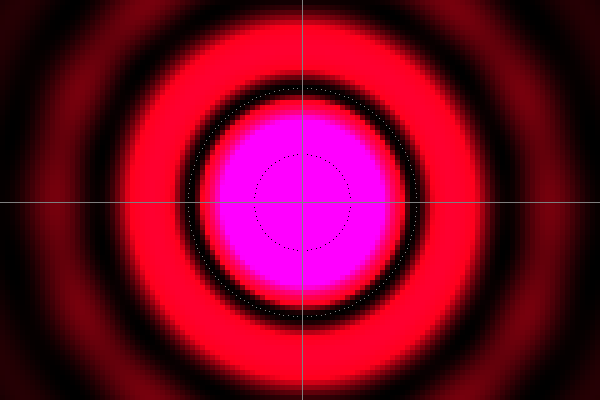 |
|
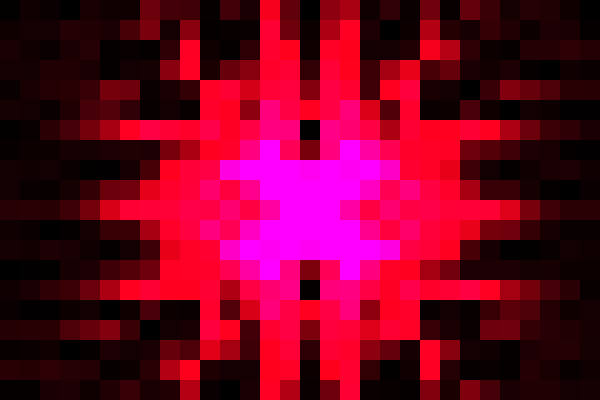
| Picture 7: Spot image simulation, sensor detail 3.3 x 2.2 mm², sensor detail center offset 1.5 mm horizontal and 3.7 mm vertical, f = 23 mm, D = f / 8, λ = 20×643.8 nm, 104-fold saturated |
Picture 8: Spot image simulation, sensor detail 660 x 440 µm², sensor detail center offset 1.5 mm horizontal and 3.7 mm vertical, f = 23 mm, D = f / 8, λ = 20×643.8 nm, 102-fold saturated |
In pictures 7 and 8, highly saturated zones appear in magenta instead of white because the chosen red color comes with zero for the green channel. See the following table therefor.
For deeper insights, we change from the monochromatic radiation of a single point to a somehow weighted 5-wavelength radiation. The radiator itself is still a single point. One way to select different wavelengths is to formally choose basic RGB values, as #ff0000, #ffff00, #00ff00, #00ffff, #0000ff and #ff00ff for example, and try to attach wavelengths to them. With Jan Behrens's visible spectrum in sRGB together with the CIECAM02 color appearance model, one would obtain for the wavelengths 630.47 nm, 571.01 nm, 542.27 nm, 490.43 nm, 454.19 nm, and nothing for magenta. Another way is to select any strong lines from the NIST basic atomic spectroscopic data base, so being sure that the wavelengths actually exist, and determine the RGB values accordingly, again using Jan Behrens's table. The latter happened here.
| # | color | $\lambda$/nm | spectrum | RGB | $A_{\mathrm{s}\bullet}$ |
| 1 | red | 643.8 | Cd I | #ff001c | 0.63045581 |
| 2 | yellow | 589.3 | Na I D1/D2 doublet | #ffa000 | 0.66383710 |
| 3 | green | 546.1 | Hg I | #56ff00 | 0.69503097 |
| 4 | cyan | 484.4 | Xe II | #00e5ff | 0.87948408 |
| 5 | blue | 451.1 | In I | #2e00ff | 1.00000000 |
Magenta does not exist. There is no wavelength belonging to that color. The amplitudes in the last column have been determined in such a manner that the 5λ light our radiator now emits does appear white in the emitter-side half space up to the diaphragm plane. Since the quadratic system of equations to do so is underdetermined, the following three arbitrarily fixed constraints have been introduced. \begin{align}% \label{labelfivelambdaamplitudeyellow}A_{\mathrm{s}\bullet\;\mathrm{yellow}}\;&=\;% A_{\mathrm{s}\bullet\;\mathrm{red}}\;\;\;+\;% \frac{\displaystyle\,1/\lambda_\mathrm{\:\!yellow}-1/\lambda_\mathrm{\:\!red}}{% \displaystyle1/\lambda_\mathrm{\:\!green}-1/\lambda_\mathrm{\:\!red}}% (A_{\mathrm{s}\bullet\;\mathrm{green}}-A_{\mathrm{s}\bullet\;\mathrm{red}})\\ \label{labelfivelambdaamplitudecyan}A_{\mathrm{s}\bullet\;\mathrm{cyan}}\;&=\;% A_{\mathrm{s}\bullet\;\mathrm{green}}\;+\;% \frac{\displaystyle1/\lambda_\mathrm{\:\!cyan}-1/\lambda_\mathrm{\:\!green}}{% \displaystyle1/\lambda_\mathrm{\:\!blue}-1/\lambda_\mathrm{\:\!green}}% (A_{\mathrm{s}\bullet\;\mathrm{blue}}-A_{\mathrm{s}\bullet\;\mathrm{green}})\\ \label{labelfivelambdaamplitudeblue}A_{\mathrm{s}\bullet\;\mathrm{blue}}\;&=\;1% \end{align} Recall, while coherent radiation is superposed adding the wave functions themselves, incoherent radiation is superposed adding the intensities, i.e., summing up the squared absolute values of the wave functions, see also (\ref{labelIntensity}). Different monochromatic components of a radiation mix are mutually incoherent. So they cannot interfere.
Let us study how the above white 5λ light our point source is now emitting appears in the target plane. The wavelengths are again upscaled with a common factor of 20. (\ref{labeltargetsidewavefunctionfin}) has again been evaluated summing up 3.1×10⁶ ordinates per image point, i.e., again 9 samples per λred. So pictures 9 and 10 will basically show the same as pictures 3 and 4.
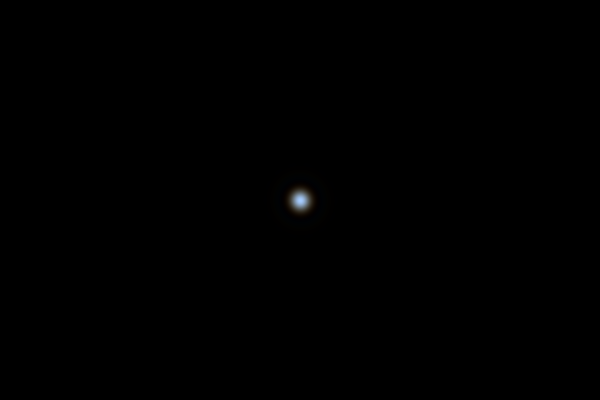 |
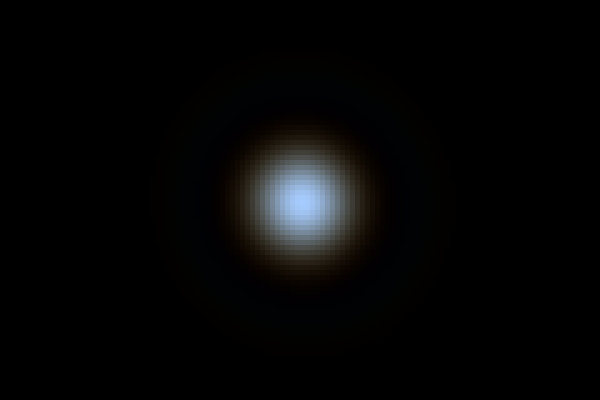 |
|
| Picture 9: 5λ spot image simulation, sensor detail
3.3 x 2.2 mm², sensor detail center offset 1.5 mm horizontal and 3.7 mm vertical, f = 23 mm, D = f / 8, λ = 20×(643.8, 589.3, 546.1, 484.4, 451.1) nm, properly exposed |
Picture 10: 5λ spot image simulation, sensor detail
660 x 440 µm², sensor detail center offset 1.5 mm horizontal and 3.7 mm vertical, f = 23 mm, D = f / 8, λ = 20×(643.8, 589.3, 546.1, 484.4, 451.1) nm, properly exposed |
The diameter of the Airy-disk-like diffraction pattern in picture 10 is somewhat smaller than the one of the respective pattern in picture 4. The center of the pattern tends toward blue while the darker parts of the pattern show a lack of this color.
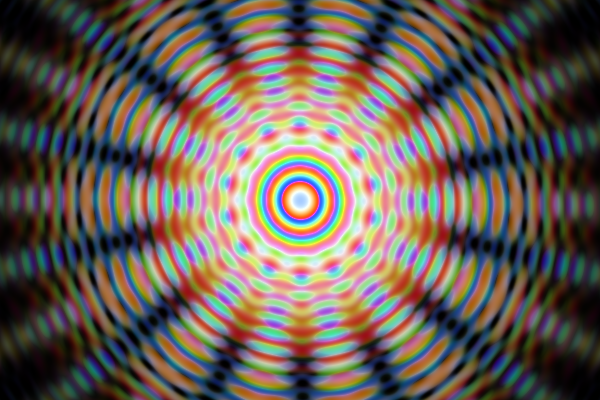 |
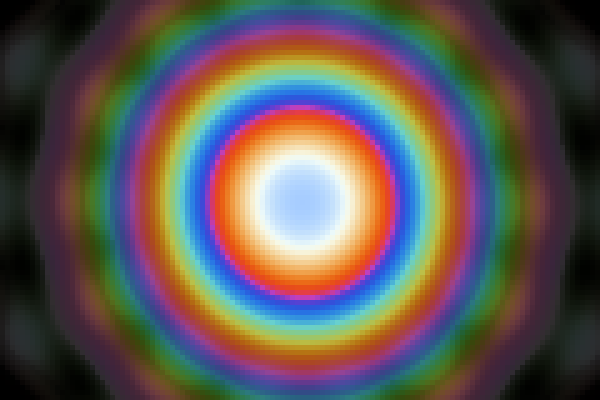 |
|
| Picture 11: 5λ spot image simulation, sensor detail
3.3 x 2.2 mm², sensor detail center offset 1.5 mm horizontal and 3.7 mm vertical, f = 23 mm, D = f / 8, λ = 20×(643.8, 589.3, 546.1, 484.4, 451.1) nm, HSV coordinate Value nonlinearly mapped for contrast adjustment |
Picture 12: 5λ spot image simulation, sensor detail
660 x 440 µm², sensor detail center offset 1.5 mm horizontal and 3.7 mm vertical, f = 23 mm, D = f / 8, λ = 20×(643.8, 589.3, 546.1, 484.4, 451.1) nm, HSV coordinate Value nonlinearly mapped for contrast adjustment |
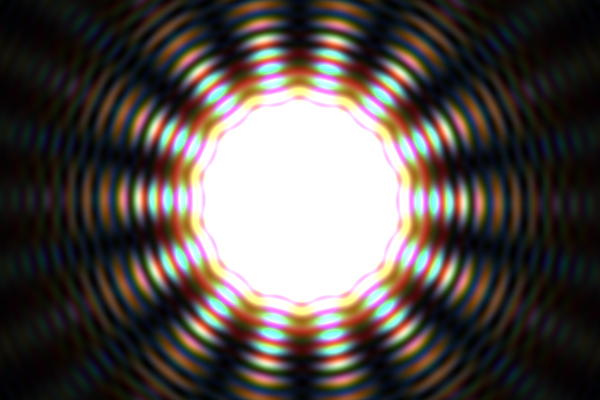 |
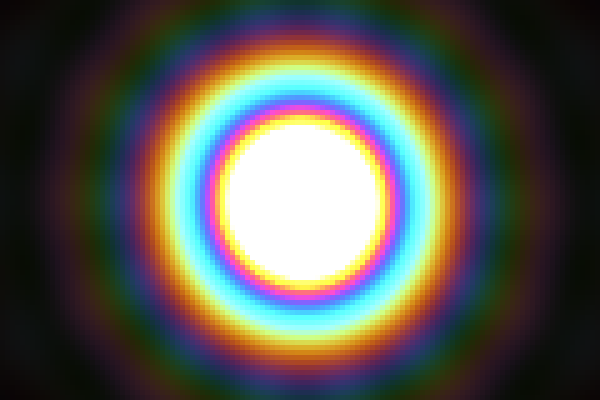 |
|
| Picture 13: 5λ spot image simulation, sensor detail
3.3 x 2.2 mm², sensor detail center offset 1.5 mm horizontal and 3.7 mm vertical, f = 23 mm, D = f / 8, λ = 20×(643.8, 589.3, 546.1, 484.4, 451.1) nm, 104-fold saturated |
Picture 14: 5λ spot image simulation, sensor detail
660 x 440 µm², sensor detail center offset 1.5 mm horizontal and 3.7 mm vertical, f = 23 mm, D = f / 8, λ = 20×(643.8, 589.3, 546.1, 484.4, 451.1) nm, 102-fold saturated |
It is quite impressive what pictures 11 and 13 show here, but it is also difficult to imagine how superpositions of picture 13, for example, can lead to patterns as seen with photograph 3. As pictures 5 and 7 exhibit in red, a diffraction pattern of 14 fat wheel spokes with a lot of colors is seen, surrounding a hub. That hub is white in picture 13, white from cutting. The spatial frequency in the radial direction corresponds to the dimension of the Airy-disk-like pattern in picture 9. In addition, some contrast structures that already appeared in picture 5 might be seen as the second harmonic.
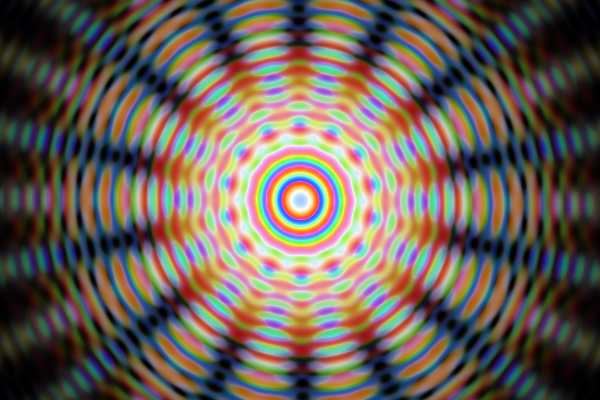
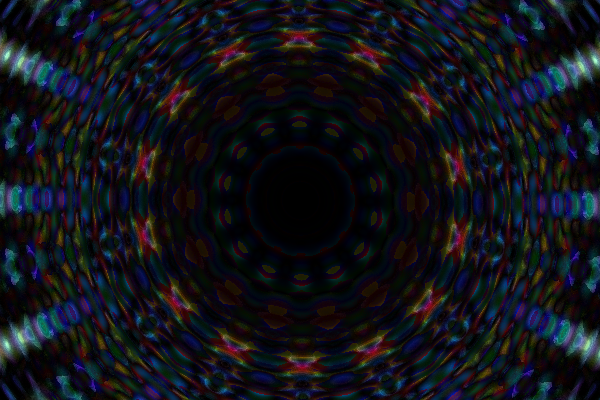
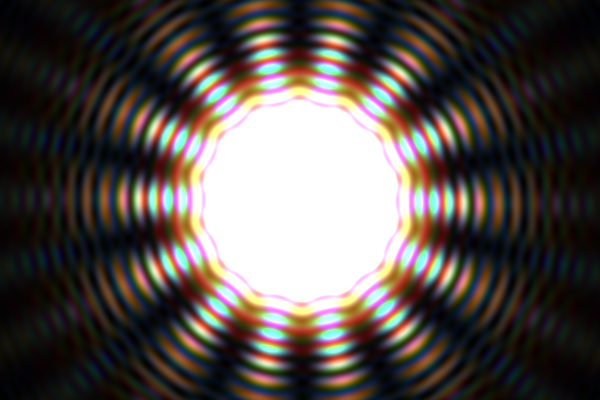
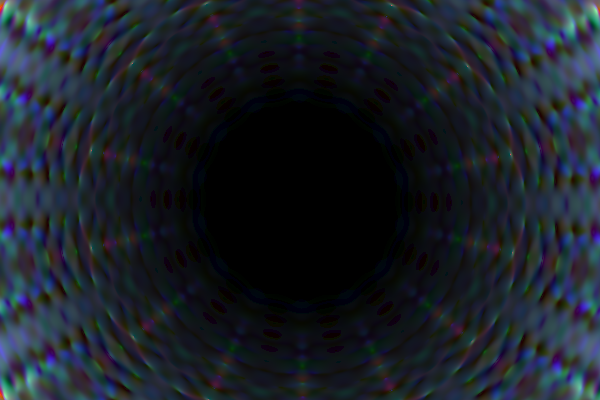
Next, it raises the question of how stable the patterns in pictures 11 and 13 are when the number of ordinates used for the summation in (\ref{labeltargetsidewavefunctionfin}) varies.
 |
 |
|
| Picture 15: Same as picture 11 but only 2 samples per λred |
Picture 16: Absolute RGB deviation of picture 15 from picture 11, intensities multiplied by 426 |
 |
 |
|
| Picture 17: Same as picture 13 but only 2 samples per λred |
Picture 18: Relative RGB deviation of picture 17 from picture 13, intensities multiplied by 50 |
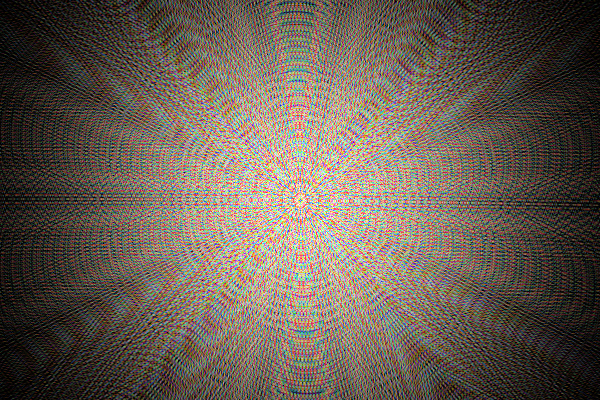
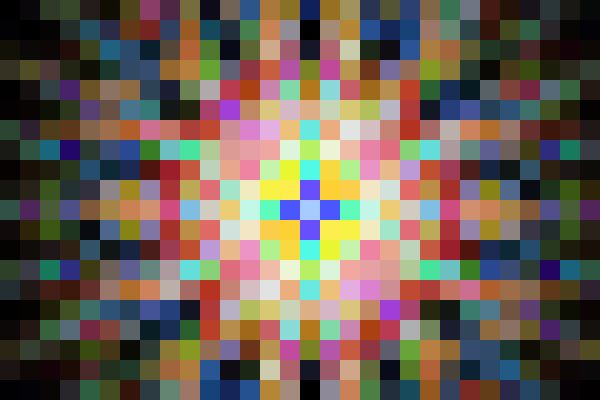
For picture 11, 3.1×10⁶ ordinates have been summed up per image point, for picture 15 only 1.6×10⁵. So we have only 2 samples per λred. To find out how sensitive the image content reacts upon the ordinate number, it ideally should not, the absolute difference of the RGB values of picture 15 and picture 11 is presented by means of picture 16, where all values have been multiplied by 426 such that the brightest points do just not go into saturation. So, it can be concluded that the deviation of picture 15 from picture 11 is 0.002 in units of the maximum. The largest differences are found on the foothills, i.e., on the far-off ends of the spikes, not very surprising. Further, picture 18 shows the relative deviation of picture 17 from picture 13, about 2 percent, and relative to the local image point, not to the image maximum. Whether calculations based on 3.1×10⁶ ordinates per image point here, or, 9 samples per λred, are sufficiently accurate for the final superposition is at least at the moment not clear.
We have to come back to wavelengths as they actually occur in our photographs. To do so the easiest and straightforward way is to compile the above mentioned program for MPI, a suitable command line could look like
cc -DMYUSEMPI -O3 -o Diffraction Diffraction.c -lm -lmpi # ,
and perform the following three executions.
  mpirun -np 240000 ./Diffraction 2 5 10 1 7 20000 0 400 0 600 0 # assume  1 hour  with 240000 P4@2.5GHz processors
  mpirun -np 240000 ./Diffraction 2 5 10 1 7 40000 0 400 0 600 0 # assume  4 hours with 240000 P4@2.5GHz processors
  mpirun -np 240000 ./Diffraction 2 5 10 1 7 80000 0 400 0 600 0 # assume 16 hours with 240000 P4@2.5GHz processors
Off course, executions like these need a TOP500 class system with at least 240000 processing elements.
@@@@@@@@@@@@@@@@@@@@@@@@@@@@ ... thinking ... @@@@@@@@@@@@@@@@@@@@@@@@@@@@
 |
 |
|
| Picture 19: Spot image simulation, sensor detail
165 x 110 µm², sensor detail center offset 1.5 mm horizontal and 3.7 mm vertical, f = 23 mm, D = f / 8, λ = 643.8, nm, 18 samples per wavelength, HSV coordinate Value nonlinearly mapped for contrast adjustment |
Picture 20: Spot image simulation, sensor detail
165 x 110 µm², sensor detail center offset 1.5 mm horizontal and 3.7 mm vertical, f = 23 mm, D = f / 8, λ = 643.8, nm, 18 samples per wavelength, 104-fold saturated |
@@@@@@@@@@@@@@ ... is invariant under a point reflection ... @@@@@@@@@@@@@
@@@@@@@@@@@@@@ ... no 14-fold symmetry ... @@@@@@@@@@@@@
@@@@@@@@@@@@@@@@@@@@@@@@@@@@ ... thinking ... @@@@@@@@@@@@@@@@@@@@@@@@@@@@
 |
 |
|
| Picture 21: 5λ spot image simulation, sensor detail
3.3 x 2.2 mm², sensor detail center offset 1.5 mm horizontal and 3.7 mm vertical, f = 23 mm, D = f / 8, λ = (643.8, 589.3, 546.1, 484.4, 451.1) nm, 2 samples per λred HSV coordinate Value nonlinearly mapped for contrast adjustment |
Picture 22: 5λ spot image simulation, sensor detail
165 x 110 µm², sensor detail center offset 1.5 mm horizontal and 3.7 mm vertical, f = 23 mm, D = f / 8, λ = (643.8, 589.3, 546.1, 484.4, 451.1) nm, 2 samples per λred HSV coordinate Value nonlinearly mapped for contrast adjustment |
@@@@@@@@@@@@@@@@@@@@@@@@@@@@ ... thinking ... @@@@@@@@@@@@@@@@@@@@@@@@@@@@
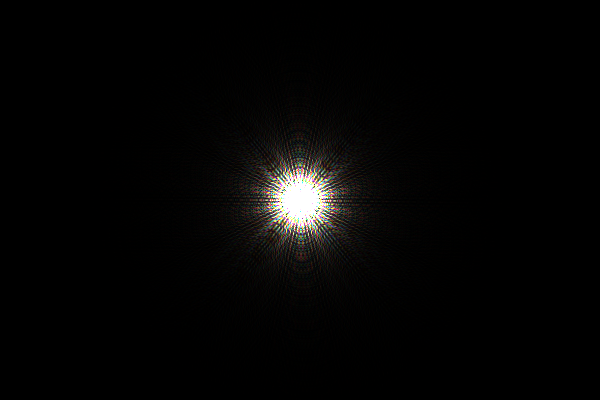 |
 |
|
| Picture 23: 5λ spot image simulation, sensor detail
3.3 x 2.2 mm², sensor detail center offset 1.5 mm horizontal and 3.7 mm vertical, f = 23 mm, D = f / 8, λ = (643.8, 589.3, 546.1, 484.4, 451.1) nm, 2 samples per λred, 106-fold saturated |
Picture 24: 5λ spot image simulation, sensor detail
165 x 110 µm², sensor detail center offset 1.5 mm horizontal and 3.7 mm vertical, f = 23 mm, D = f / 8, λ = (643.8, 589.3, 546.1, 484.4, 451.1) nm, 2 samples per λred, 104-fold saturated |
@@@@@@@@@@@@@@@@@@@@@@@@@@@@ ... thinking ... @@@@@@@@@@@@@@@@@@@@@@@@@@@@